Women and girls made up slightly more than half of the 44.7 million immigrants residing in the United States in 2018. The female share of the foreign-born population is higher in the United States (52 percent) than it is globally, where women and girls account for about 48 percent of all international migrants. One explanation for this difference is that close to two-thirds of the global migrant population is made up of migrant workers, who are more likely to be male (58 percent of all international migrant workers) and who often are not allowed to bring families along. In contrast, family reunification dominates U.S. immigration flows.
Immigrants represent about 14 percent of all females resident in the United States. As mothers, workers, and students, female immigrants make important contributions to local communities, the economy, and society. They come from diverse origins and linguistic backgrounds, and have varied levels of education and work experiences, which in turn shape their social and economic integration. Their experiences in the United States compared to immigrant men and to U.S.-born women raise implications for sending and receiving countries, with respect to labor opportunities, family structure, gender roles, and more.
Using data from the United Nations Population Division, the U.S. Census Bureau’s 2018 American Community Survey (ACS), and the Department of Homeland Security’s Yearbook of Immigration Statistics, this Spotlight provides information on the population of female immigrants in the United States, highlighting their education, employment, marital status, fertility, and other key socioeconomic characteristics, with comparison to both native-born females and immigrant men.
Origins
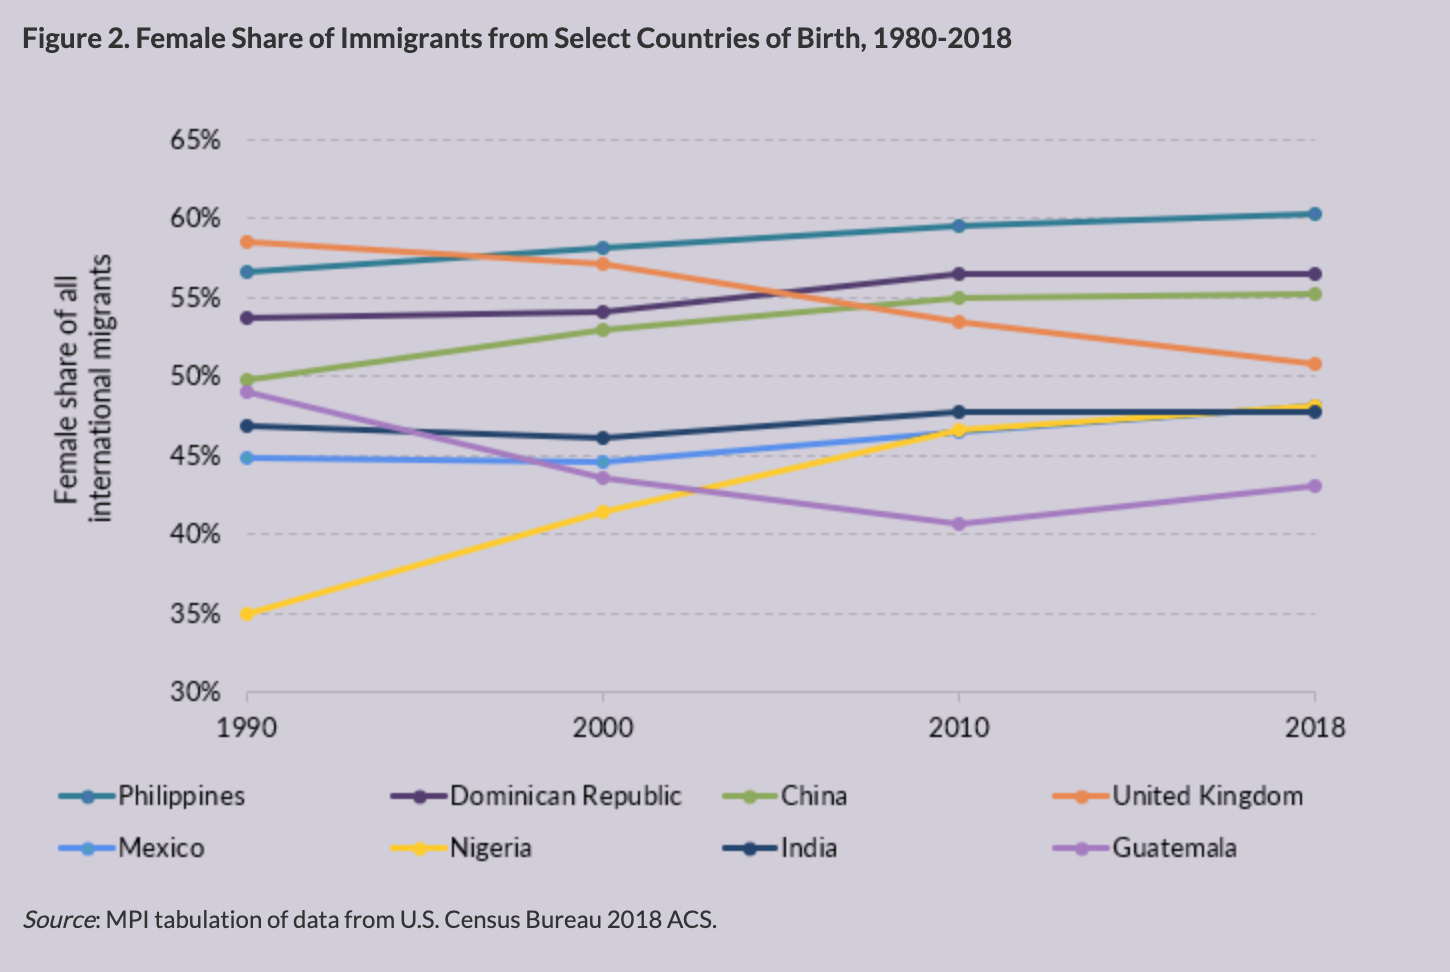
The gender composition of immigrants living in the United States varies greatly by country of origin and over time. Overall, immigrants from the Caribbean, South America, Asia, and Europe are more likely to be women, while those from Mexico and Central America are more likely to be men. The patterns reflect the changing gender make-up of new arrivals, longer longevity of women, and the main pathways and reasons individual origin groups come to the United States, following the last major revisions to the U.S. immigration system in 1990.
Age and Marital Status
Immigrant women were generally older than U.S.-born women, with average ages of 47 and 39, respectively, according to 2018 ACS estimates, which has a lot to do with the different age distribution among the foreign- and native-born female populations. Immigrant women are significantly more likely to be of working age than their native-born counterparts because immigrants tend to come to the United States for work and family reunification. Children born in the United States to immigrant women are U.S. born, further skewing the U.S.-born population’s age distribution to younger age groups. Twenty-seven percent of U.S.-born females are under age 20, compared to only 7 percent among female immigrants.
As a whole, immigrants are more likely to be married, and less likely to be separated, divorced, widowed, or single than the native born, regardless of gender. Men, regardless of nativity, are more likely to be married as well as single, but are less likely to be separated, divorced, or widowed compared to their female counterparts. Immigrant women were much more likely to be married in 2018 than U.S.-born women: 58 percent versus 44 percent.

Educational Attainment
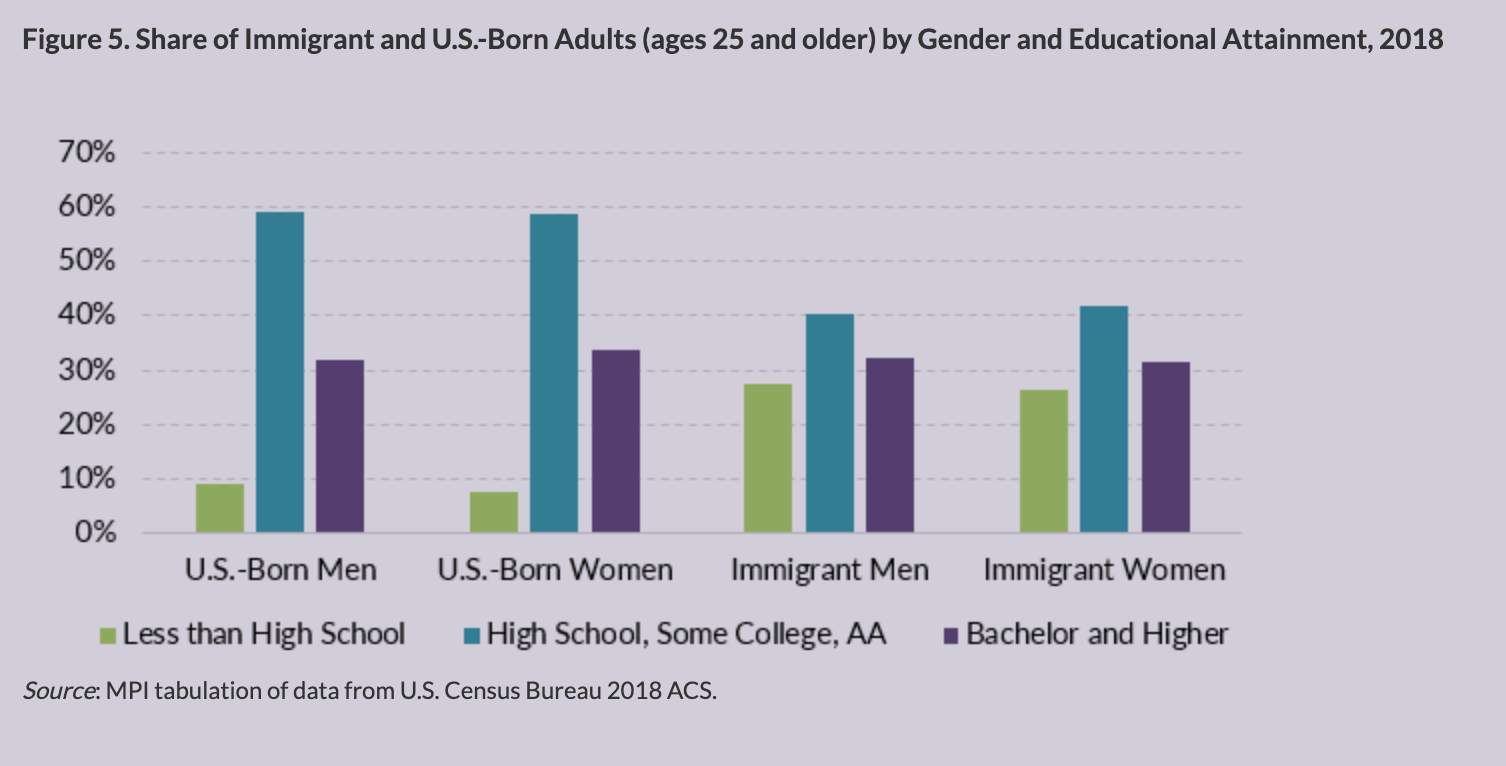
While immigrants are more likely than their native-born peers to lack a high school education and as likely to have a four-year college degree, there was little variation in the educational attainment between women and men among all immigrants and natives in 2018.
However, educational attainment varied substantially by country of origin. Among the ten largest origin groups (each with at least 1 million immigrants in the United States)—Mexico, India, China/Hong Kong, the Philippines, El Salvador, Vietnam, Cuba, the Dominican Republic, Korea, and Guatemala—women from Asian countries were more educated than those from Latin America. Cuban immigrants were the exception as they were the most likely to have earned a high school or an associate’s degree, although less likely than Asian female immigrants to have obtained a bachelor’s degree or higher.
Though still lower in educational attainment than their male counterparts, women from India (76 percent), the Philippines (52 percent), and Korea (51 percent) were more likely to be college graduates among the top ten countries; women from El Salvador, Guatemala, and Mexico (7-8 percent) were the least likely.
Employment and Occupations
Although immigrants (ages 16 and older) as a whole participated in the civilian labor force at higher rates than native-born individuals (66 percent versus 62 percent), immigrant women had a slightly lower rate of workforce participation than their native-born counterparts (57 percent versus 59 percent).
As of 2018, there were more than 11.9 million workers who were immigrant women (ages 16 and older), comprising 16 percent of all female workers and 8 percent of all U.S. civilian workers. Thirty-six percent of immigrant women were employed in management, business, science, and arts occupations (which includes education and higher skilled health-care occupations); followed by 31 percent employed in service occupations (such as hospitality). Immigrant women were as likely as U.S.-born men to be employed in management, business, science, and related occupations but much less likely than U.S.-born women. At the same time, immigrant women were much more likely to be employed in service occupations than the other groups.

Poverty
Immigrant women fared worse on poverty measures than either immigrant men (with 16 percent living in poverty compared to 13 percent for their male counterparts) or the native-born population (with 14 percent of U.S.-born women and 12 percent of U.S.-born men in poverty). However, employed female immigrants (9 percent) were less likely to be in poverty than immigrant women overall (16 percent); they were roughly as likely as their male counterparts to be working poor (8 percent).
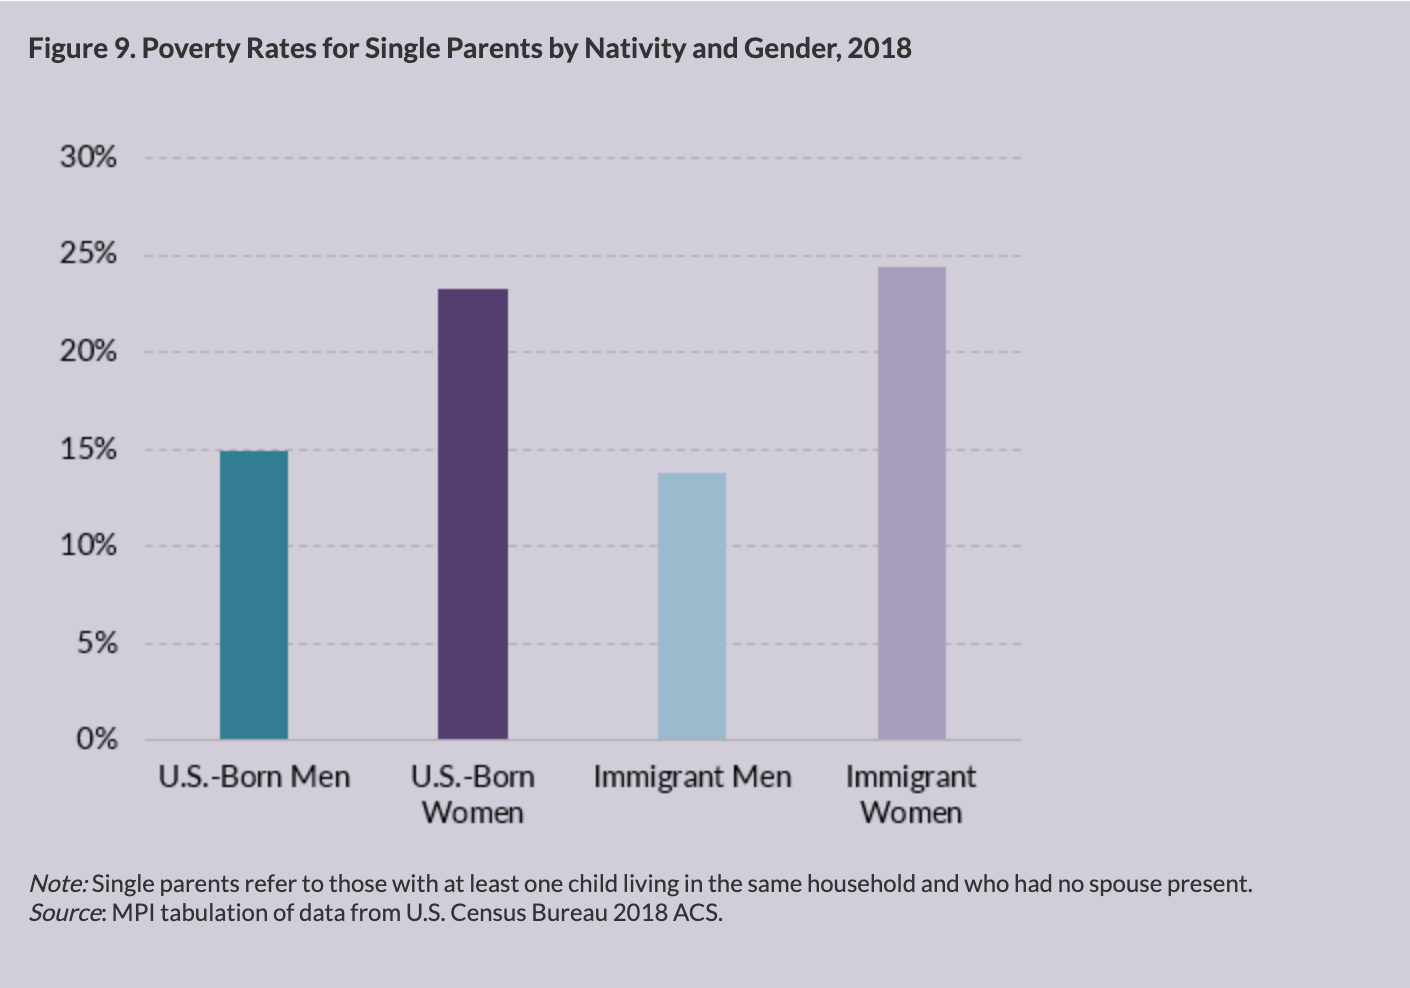
Single parenthood has been a strong predictor for poverty; single mothers, in particular, encounter significant financial hardship. As of 2018, almost one-quarter of single mothers, regardless of nativity, lived in poverty, compared to 14-15 percent of single fathers.
Citizenship and Immigration Status
As of 2018, 53 percent (12.3 million) of all immigrant women were naturalized U.S. citizens, compared to 48 percent of immigrant men (10.4 million).
Women accounted for a larger share among new naturalized citizens in 2018 (55 percent of 762,000 new citizens) and among legal permanent residents (53 percent of 1.1 million new green-card holders) than men, according to data from the Department of Homeland Security (DHS). Among refugees admitted and those granted affirmative asylum in 2018, women and men represented equal shares.
In contrast, the female share of migrants apprehended at the U.S.-Mexico border is much lower; it was 35 percent in 2019. Still, that share is up from earlier years (e.g., 14 percent in 2012), in part because more families are migrating.
Another category of migrants—spouses of highly skilled temporary workers—also bucks the trend: Of the 6,800 employment authorization cards approved for certain spouses on H-4 visas, 92 percent went to women.
Unauthorized Population
Women composed 47 percent of the 11.3 million unauthorized immigrants in the United States in the 2012-16 period, according to the latest estimates from the Migration Policy Institute. In Hawaii and Missouri, the female share was higher: 56 percent in Hawaii and 50 percent in Missouri. On the other end of the continuum, the share of females among the unauthorized was lower than the national share by 5 or more percentage points in South Carolina and Louisiana (42 percent each) and Mississippi (38 percent).
This article was reprinted with permission by Migration Policy Institute. This article was written by Jeanne Batalova and published by MPI’s online journal, the Migration Information Source on March 4, 2020.