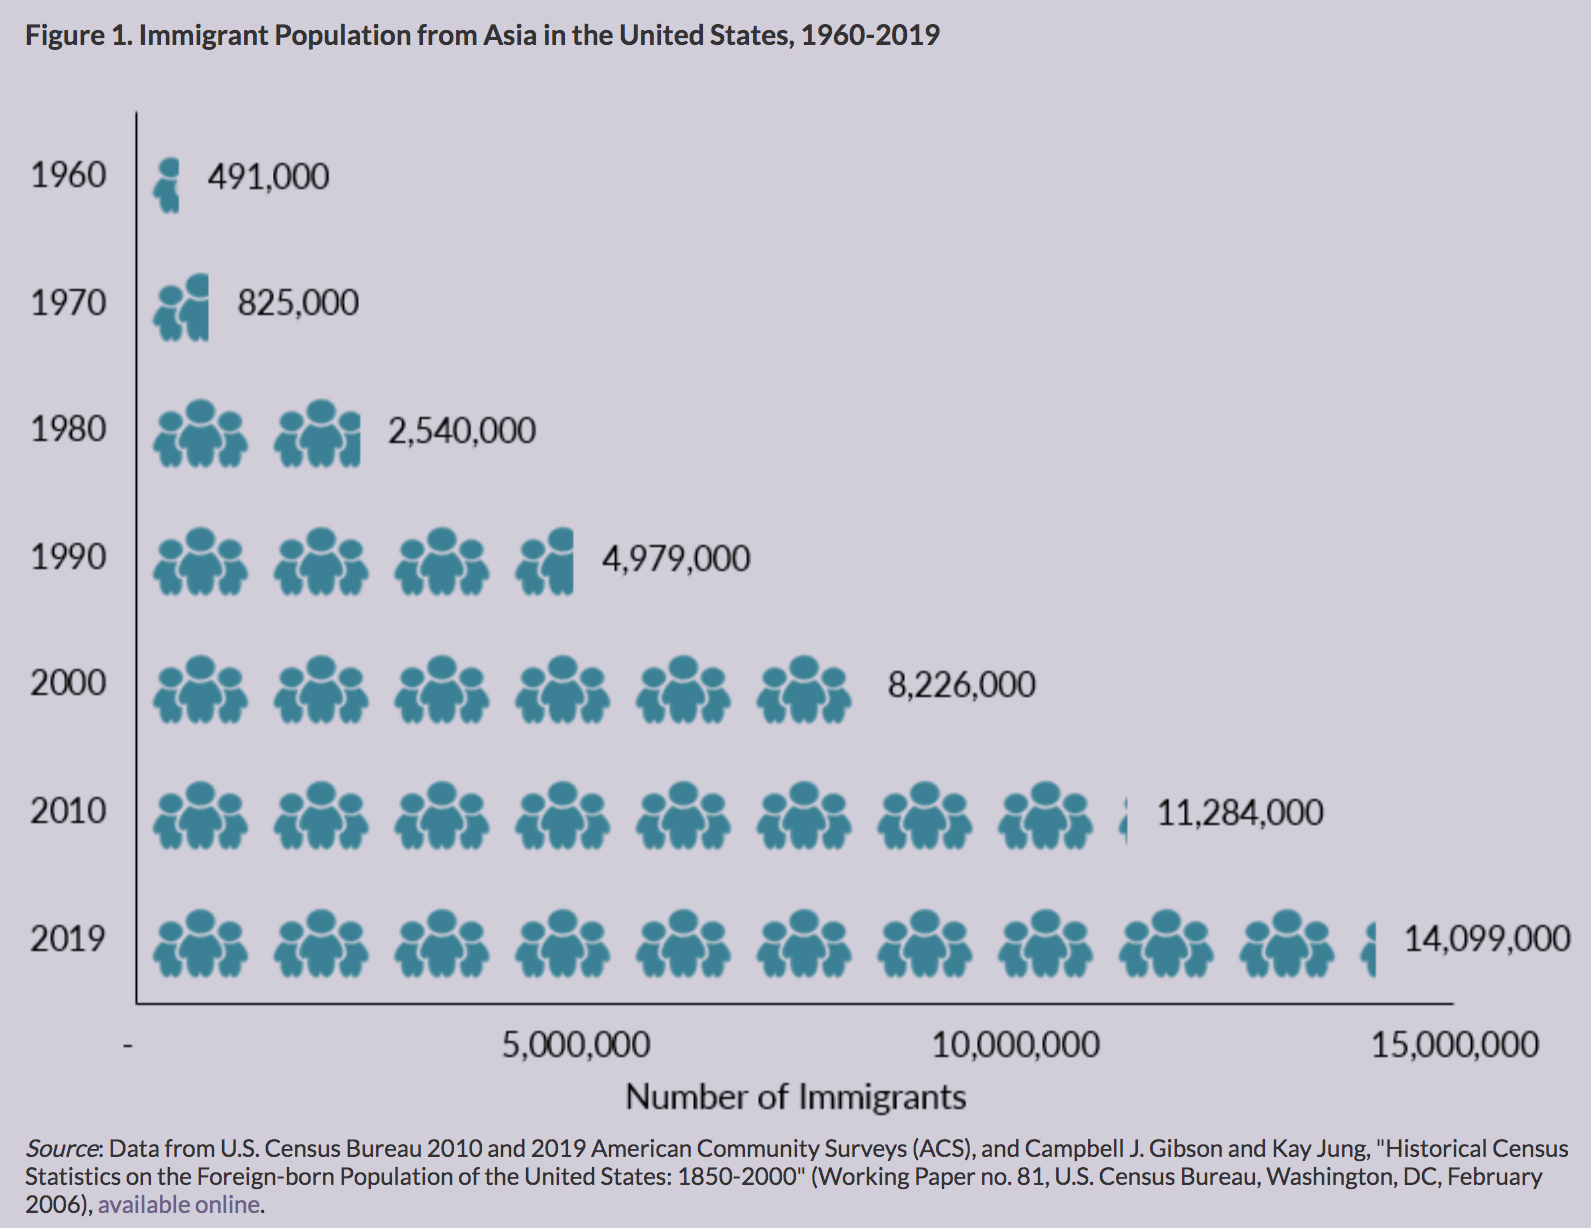
Migration from Asia to the United States has risen sharply since the mid-1960s, following the end of exclusionary immigration laws enacted in the late 19th and early 20th centuries that severely limited arrivals from countries across the Asian continent. With the passage of the 1965 Immigration and Nationality Act, the number of immigrants from Asian countries in the United States grew considerably. As of 2019, there were 14.1 million immigrants from Asia residing in the United States, representing a 29-fold increase from 1960. Today, people born on the continent of Asia account for 31 percent of the 44.9 million immigrants in the United States. This number refers to national origin, not race or ethnicity; while most immigrants from Asian countries identify as Asian, others describe themselves as White or as members of other racial groups.
Asia is the second-largest region of birth for U.S. immigrants, after the Americas, and since 2013 India and China have been the leading origin countries, displacing Mexico. Looking forward, arrivals from Asia are projected to comprise a greater share of all immigrants, becoming the largest foreign-born group by 2055, according to Pew Research Center estimates. In 2019, India, China, and the Philippines were the top origin countries of immigrants from Asia. While the majority of pre-1965 immigrants from Asia were low-skilled laborers, the foreign-born from the region today are more likely than the overall U.S.-born and immigrant populations to earn higher incomes, to work in management occupations, and to be highly educated, although these trends vary by country of origin.
Distribution by Region and Country of Origin
Asian migration to the United States, especially from South Eastern and Eastern Asia, grew rapidly between 1960 and 2019 (see Figure 2). The number of immigrants from South Central Asia also rose sharply since 2000, partly due to the inclusion of former Soviet Union countries (e.g., Uzbekistan and Kazakhstan) previously classified as Europe. Meanwhile, the number of Western Asian immigrants in the United States has grown steadily, but at a slower rate.
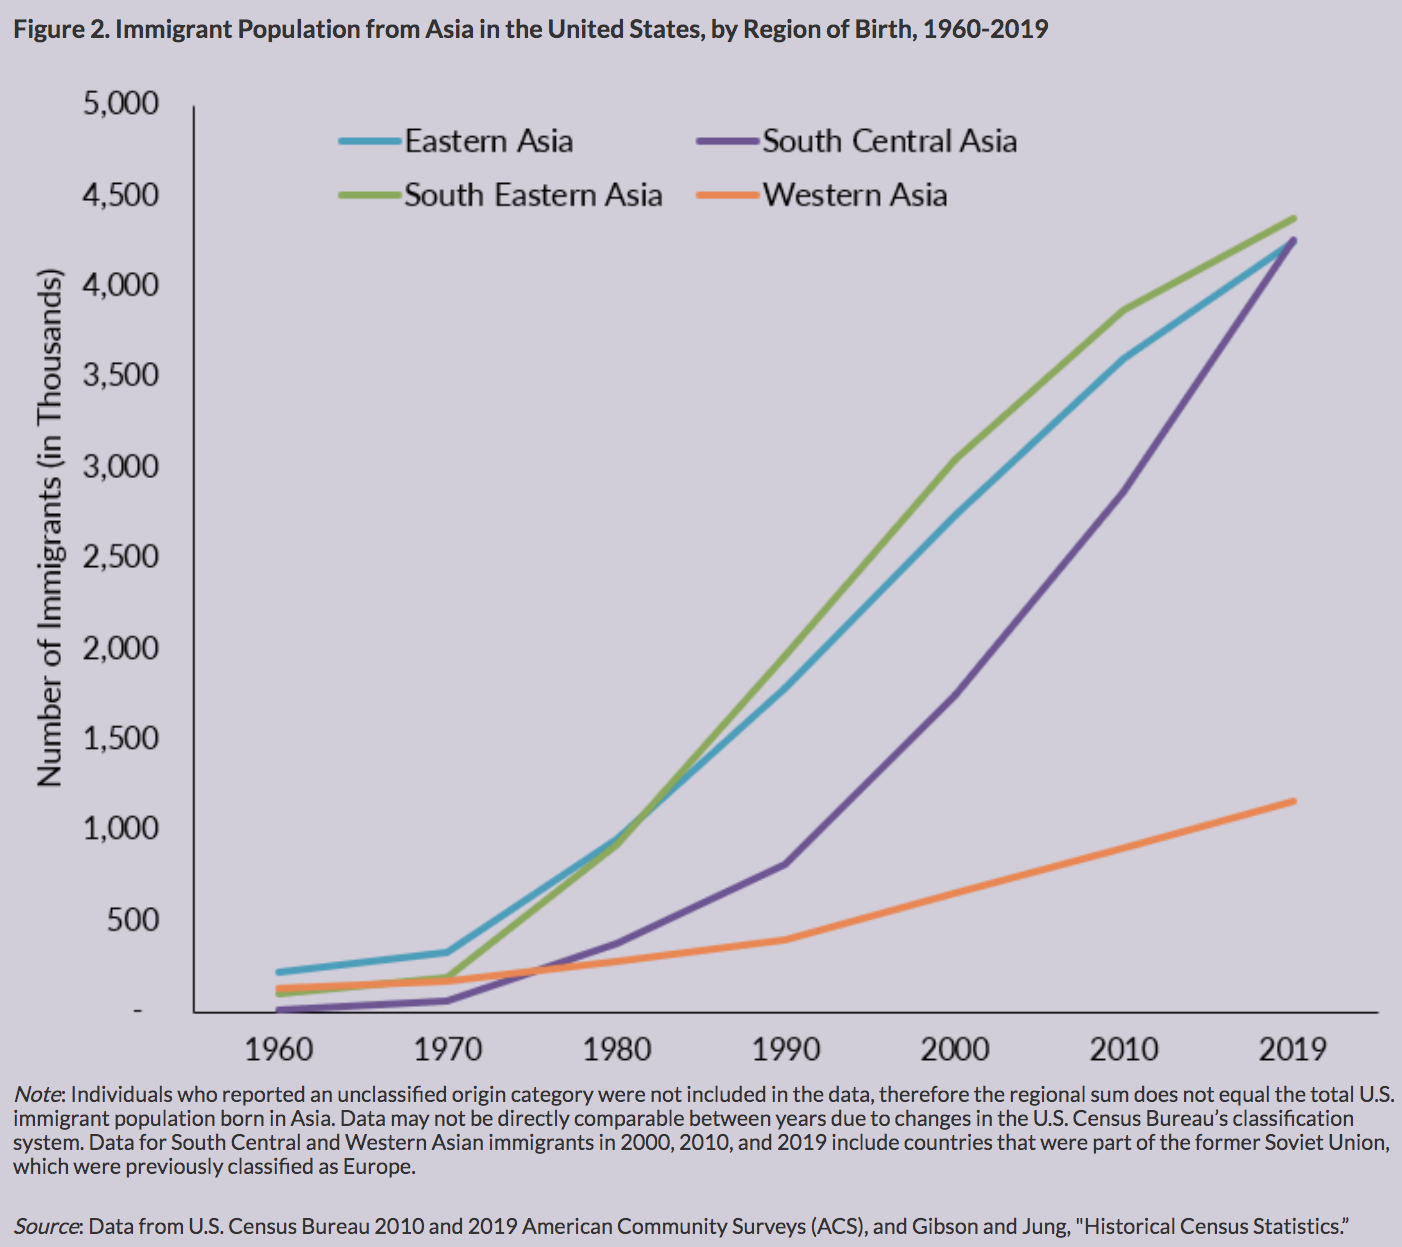
In 2019, South Eastern Asia accounted for the largest share of the total Asian immigrant population (4.4 million), followed closely both South Central Asia (4.3 million) and Eastern Asia (4.2 million), and then by Western Asia (1.2 million)
The largest countries of origin were India (2.7 million, or 19 percent of Asian immigrants); China, including Hong Kong (2.5 million, 18 percent); the Philippines (2 million, 15 percent); Vietnam (1.4 million, 10 percent); and South Korea and North Korea (1 million, 7 percent), which the U.S. Census Bureau combines in its published data although the vast majority of the Korean Peninsula’s immigrants come from South Korea. Together, these countries accounted for almost 70 percent of the total Asian immigrant population in 2019. These countries were also among the top ten origin countries of all immigrants, representing one-fifth of the total U.S. foreign-born population. The Migration Information Source offers Spotlights for several Asian countries, including for immigrants in the United States from India, China, the Philippines, Vietnam, and Korea.
Distribution by State and Key Cities
Close to half (48 percent) of immigrants from Asia have settled in three states: California (30 percent), New York (9 percent), and Texas (8 percent). The top four counties with immigrants from Asia were Los Angeles, Santa Clara, and Orange in California, and Queens in New York. Together, these four counties accounted for about 19 percent of the total Asian immigrant population in the United States. In the 2015-19 period, the U.S. cities with the largest number of immigrants from Asia were the greater Los Angeles, New York, and San Francisco metropolitan areas. These three metro areas accounted for approximately 31 percent of the Asian-born population residing in the United States.
English Proficiency and Language Diversity
Compared to the overall foreign-born population, immigrants from Asia are more likely to be proficient in English but less likely to speak English at home. In 2019, approximately 42 percent of immigrants from Asia (ages 5 and over) reported limited English proficiency, compared to 46 percent of all immigrants. Those from Eastern Asia were the most likely to be Limited English Proficient (LEP), at 53 percent, followed by immigrants from South Eastern Asia (45 percent), Western Asia (37 percent), and South Central Asia (29 percent). The Asian-origin countries with the highest share of LEP individuals were Myanmar (71 percent), Vietnam (65 percent), Laos (62 percent), and Uzbekistan and Cambodia (59 percent each). Asian-origin countries with the lowest share of LEP individuals were Israel (15 percent), India (22 percent), and Lebanon and the Philippines (28 percent each).
Approximately 13 percent of immigrants from Asia spoke only English at home in 2019, versus 16 percent of all immigrants. The top ten foreign languages spoken by Asian immigrants are Chinese (including Mandarin and Cantonese), Tagalog (including Filipino), Vietnamese, Korean, Hindi, Arabic, Urdu, Telugu, Persian (including Farsi and Dari), and Gujarati. Note: Limited English proficiency refers to those who indicated on the ACS questionnaire that they spoke English less than “very well.”
Race and Ethnicity
For the most part, immigrants from Asia identify as Asian. More than 84 percent in 2019 reported their race as non-Latino Asian, followed by 12 percent who identified as non-Latino White. Smaller shares of immigrants from Asia reported other races: 3 percent as multi-racial, and less than 0.5 percent each reported being non-Latino Black, Latino, or unspecified race. Among all immigrants, 44 percent reported being Latino, 27 percent non-Latino Asian, 17 percent non-Latino White, 9 percent non-Latino Black, 1 percent multiracial and less than 1 percent reported some other race.
Age, Education, and Employment
Like all immigrants, those from Asia are, on average, older than the native-born population. The median age of both Asian and all immigrants in 2019 was 46, compared to 37 for the U.S. born. In 2019, immigrants from Asia were more likely to be of working age (18 to 64,) and less likely to be under age 18 than the U.S.-born population
Immigrants from Asia on average have much higher educational attainment than both all foreign- and U.S.-born adults. In 2019, only 14 percent of immigrant adults from Asia had not completed high school, compared to 26 percent of all immigrants and 8 percent of U.S.-born adults. In contrast, more than half (54 percent) of Asian adults ages 25 and over had a bachelor’s degree or higher in 2019, compared to 33 percent of both total immigrant and U.S.-born adults.
Asia is the primary sending region of international students to the United States. In the 2019-20 school year, 835,000 students from Asia accounted for 78 percent of the 1.1 million international students enrolled in U.S. higher educational institutions. China (373,000), India (193,000), South Korea (50,000), and Saudi Arabia (31,000) were the top four origin countries of all international students, accounting for significant shares of the U.S. total (see Table 3). Over the past decade, the number of students from Asia in the United States has increased by 73 percent, with the largest increases coming from students from Oman (882 percent increase), Kuwait (243 percent increase), Bangladesh (237 percent increase), mainland China (192 percent increase), and Myanmar (163 percent increase).
Immigrants from Asia participate in the labor force at a slightly lower rate than the overall immigrant population, but a slightly higher rate than the native born. In 2019, about 65 percent of immigrants ages 16 and over from Asia were in the civilian labor force, compared to 67 percent and 62 percent of foreign- and U.S.-born individuals, respectively. More than half (53 percent) of Asian immigrants were employed in management, business, science, and arts occupations—a much higher share than the overall foreign- and U.S.-born populations (see Figure 6). In contrast, immigrants from Asia were also much less likely to be employed in natural resources, construction, and maintenance occupations (3 percent).
Immigration Pathways and Naturalization
Immigrants from Asia are more likely than the overall foreign-born population to be naturalized citizens. As of 2019, 61 percent of the 14.1 million immigrants from Asia in the United States were the U.S. naturalized citizens, compared to 52 percent of all immigrants. Immigrants from Cambodia (81 percent), Laos (80 percent), Taiwan and Lebanon (78 percent each), and Vietnam and Iran (76 percent each) had the highest naturalization shares, while those from Saudi Arabia (27 percent), Japan (34 percent), Nepal (36 percent), and Afghanistan (41 percent) were the least likely to be naturalized.
Of the more than 1 million individuals who obtained legal permanent residency (LPR, also known as getting a green card) in FY 2019, approximately 364,800 (35 percent) were from Asia. Mainland China (62,200), India (54,500), the Philippines (45,900), and Vietnam (39,700) were the among top 10 overall origin countries, accounting for 20 percent of all new legal permanent residents (LPRs). New immigrants from Asia were most likely to obtain legal permanent residency as immediate relatives of U.S. citizens (40 percent).
MPI estimated that approximately 110,300 youth and young adults from Asia were immediately eligible for the Deferred Action for Childhood Arrivals (DACA) program in 2020, which provides temporary relief from deportation as well as work authorization. As of December 31, 2020 (the latest data available from the U.S. government), 636,400 unauthorized youth and young adults had active DACA status, including immigrants from South Korea (6,030), the Philippines (3,190), India (2,150), Pakistan (1,110), and Indonesia (630).
Definitions
- The U.S. Census Bureau defines the foreign-born as individuals who had no U.S. citizenship at birth. The foreign-born population includes naturalized citizens, lawful permanent residents, refugees and asylees, legal nonimmigrants (including those on student, work, or other temporary visas), and persons residing in the country without authorization.
- The terms “foreign-born” and “immigrant” are used interchangeably. In this Spotlight, Asian immigrant refers to persons born in an Asian country who later emigrated to the United States. Data collection constraints do not permit the inclusion of those who gained citizenship in an Asian country via naturalization and later moved to the United States.
- The U.S. Census Bureau defines Asian regions as: Eastern Asia includes China, Hong Kong, Japan, Macau, Mongolia, North Korea, South Korea, and Taiwan.
- South Central Asia includes Afghanistan, Bangladesh, Bhutan, India, Iran, Kazakhstan, Kyrgyzstan, the Maldives, Nepal, Pakistan, Sri Lanka, Tajikistan, Turkmenistan, and Uzbekistan.
- South-Eastern Asia includes Brunei, Cambodia, Indonesia, Laos, Malaysia, Myanmar (Burma), the Philippines, Singapore, Thailand, Timor-Leste (East Timor), and Vietnam.
- Western Asia includes Armenia, Azerbaijan, Bahrain, Cyprus, Georgia, Iraq, Israel, Jordan, Kuwait, Lebanon, Oman, Qatar, Saudi Arabia, Syria, Turkey, the United Arab Emirates, and Yemen.
- Unless otherwise stated, estimates for China include Hong Kong and exclude Taiwan.
Originally published by the Migration Policy Institute’s online journal, the Migration Information Source, as: Mary Hanna & Jeanne Batalova, “Immigrants from Asia in the United States,” Migration Information Source, March 10, 2021, https://www.migrationpolicy.org/article/immigrants-asia-united-states-2020. Shortened and reprinted with permission.